
By Ana Isabel Rodrigues – Beja Polytechnic Institute
The text that we present was constructed, essentially, with excerpts from the Editorial “Analysis of Visual Data: Challenges and Opportunities for Qualitative Research” (RODRIGUES, NERI DE SOUZA and COSTA, 2017), published in Revista de Pesquisa Qualitativa.
Aires (2015), referring to research contexts, says: “any scientific activity falls within a set of spatio-temporal and sociohistorical coordinates that condition and justify its methodological options” (p.4). Thus, a new context reveals itself to the researcher who, as we know, and especially in qualitative research, is much more sensitive to what surrounds them. A context is consubstantiated in an object of study characterized by emotions, feelings, perceptions, opinions, marked by the proliferation of technology, namely the internet.
It is in the face of new challenges to qualitative research that new opportunities emerge. “We can never forget that theories and methods have to do with the reality of the world,” says Minayo (2016, p. 31). And because the world has changed a lot in the last twenty years, qualitative research is going its own way and adapting itself to the “new” reality. An example of this is the emergence of Mixed Methods based on the premise that the combined use of quantitative and qualitative methods can provide a better understanding of the phenomenon under study than just one approach (BRYMAN, 2006; CRESWELL & PLANO CLARK, 2011; GREENE, 2008). This “new” understanding of the research process, considered as the “third methodological community” (TEDDLIE & TASHAKKORI, 2012) or the “interactive community” (NEWMAN & BENZ, 1998), is an expression that for “diverse and complex contexts we need more “complete” and / or combined methodologies” (NERI DE SOUZA & COSTA, p.1).
In the same line of thought, the use of the visual element in qualitative research materializes in the so-called “visual movement” (HEISLEY, 2001), with its application roots in the field of visual anthropology. Researchers today have at their disposal a set of data with visual support such as paintings, photographs, films, drawings, diagrams, among others, allowing the introduction of new interpretive elements that enrich the analysis and understanding of its object of study. Image informs, elucidates, documents, adds value and meaning to the phenomenon itself. Banks (2007) points out two main reasons for the adoption of visual data analysis in qualitative research:
- In contemporary society, images are omnipresent, and exactly from this premise, all visual representation must potentially be considered in all scientific studies of society. That is, image is everywhere and therefore cannot be “apart” from research projects that focus on the study and understanding of the world we live in.
- A study of images or a study using visual data may reveal new sociological perspectives that are not accessible through the use of other data.
However, according to Heisley (2001), and in response to his question “Why do researchers resist the adoption of the visual element?”, the following reasons are presented:
- In general, the visual element is still considered less “serious” by academia;
- Visual understanding is accessible to all, allowing those observing multiple interpretations. This loss of control can be uncomfortable and threatening to the researcher;
- Researchers are not yet familiar with the use of “video” as a data source;
- Researchers are still influenced and biased by the idea that words are more “intellectualized” than images;
- There seems to be no “peer review” yet to legitimize its adoption;
- It is very hard work and demanding.
In addition to the reasons mentioned above, we can add the fact that it was only in the last decades that technological tools have appeared that facilitate the technical treatment of visual data, such as image and video, in qualitative analysis in an integrated and flexible way. Many of these tools are still unknown to researchers. In general terms, it is possible to identify two main aspects in the adoption of visual elements in the social sciences (BANKS, 2007, p.67):
- The first refers to the creation of images (visual data) such as videos, photographs, drawings by the researcher him/herself to document or analyze aspects of social life and social interaction. The researcher makes his/her notes, records of what he/she observes and analyzes using visual elements.
- The second concerns the collection and study of images produced and / or “consumed / observed” by the research subjects. In this case, the research project is more “visual” and there is a greater social and personal connection of the subject being studied with these same images.
Banks (2007) proposes, in this book, some solutions to this problem in the field of research and visual methods. Despite the scientific value of the form of data recording as presented in point 1 above, it is still not accepted or simply known by the academic community that most software packages already incorporate features for description, interpretation and transcription of videos and images. For example, in Figure 1 we present a system of indexing, with descriptive or inferential texts, associated to the coding and analysis of an image through webQDA software (www.webqda.net).
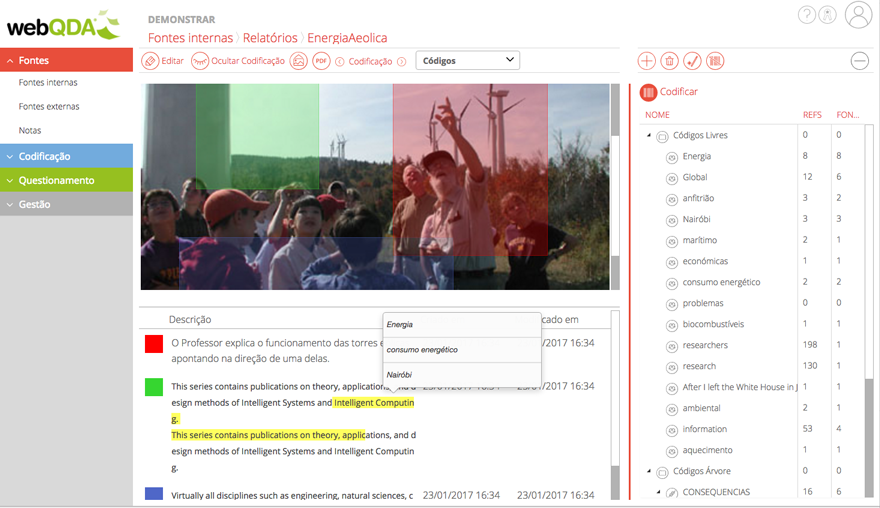
Figure 1 – Example of analyzing an image in webQDA
In sum, as Banks (2007) points out, these two strands can be understood in a contrasting way. On the one hand, in the first case, the use of images for the study of society and, on the other, a study and more sociological approach to images. These two ways are neither mutually exclusive, nor are they exhaustive and exclusive to all visual research in the social sciences. We understand that qualitative research based on visual data, supported by specific technological tools, is still at an early stage, and we need to face many challenges and issues in order for this type of data to find its place of credibility in the academic community of Human and Social Sciences.
References
AIRES, L. Paradigma Qualitativo e Práticas de Investigação Educacional. Lisboa: Universidade Aberta. 2015.
BANKS, M. Using Visual Data in Qualitative Research. Sage Publications, Thousand Oaks, CA. 2007.
BRYMAN, A. Integrating Qualitative and Qualitative Research: How is it Done? Qualitative Research, v. 6, n. 1, p. 97-113. 2006.
CRESWELL, J. W.; PLANO CLARK, V. L. Designing and Conducting Mixed Methods Research. 2ª Edição. USA: Sage. 2011.
GREENE, J.C. Is Mixed Methods Social Inquiry a Distinctive Methodology? Journal of Mixed Methods Research, v. 2, n. 1, p. 7-22. 2008.
HEISLEY, D. D. Visual Research: Current Bias and Future Direction. Advances in Consumer Research, v. 28, p. 45-47. 2001.
MINAYO, M.C.S. Fundamentos, Percalços e Expansão das Abordagens Qualitativas. In: COSTA, A.P., NERI DE SOUZA, F. & NERI DE SOUZA, D. (Eds). Investigação Qualitativa: Inovação, Dilemas e Desafios, Vol.3, Oliveira de Azeméis: Ludomedia, p. 17-48. 2016.
NERI DE SOUZA, F.; COSTA, A. P. Qual o Papel da Investigação Qualitativa no Contexto dos Métodos Mistos? In Investigação Qualitativa no Contexto dos Métodos Mistos. Revista Pesquisa Qualitativa, Editorial, v. 4, n. 5, iv-viii. 2016.
NEWMAN, I.; BENZ, C. R. Qualitative-Quantitative Research Methodology: Exploring the Interactive Continuum. USA: Carbondale and Edwardsville, Southern Illinois University Press. 1998.
RODRIGUES, A. I.; SOUZA, F. N. DE; COSTA, A. P. Análise de Dados Visuais: Desafios e Oportunidades à Investigação Qualitativa (Carta Editorial). Revista de Pesquisa de Qualitativa, p. no prelo, 2017.
TEDDLIE, C.; TASHAKKORI, A. Common “Core” Characteristics of Mixed Methods Research: A Review of Critical Issues and Call for Grater Convergence. American Behavioral Scientist, v. 56, n. 6, p. 774-788, 2012.


Leave a comment